
An engineering leader I spoke to last year had all four DORA metrics green and three senior engineers telling her, separately and unprompted, that they felt slower than they had a year ago. She assumed the measurement was broken. It was not. Her instruments were reporting, accurately, that a large individual gain was being absorbed somewhere between the keystroke and production, and she had no framework that could show her where.
That gap is the subject of this article. Measurement will not rescue you: the disciplines here, deep modules and contraction and separated commits and sized domains, are judgement calls no number will make for you. What measurement can do is tell you whether you are lying to yourself. This year it is doing that with unusual clarity.
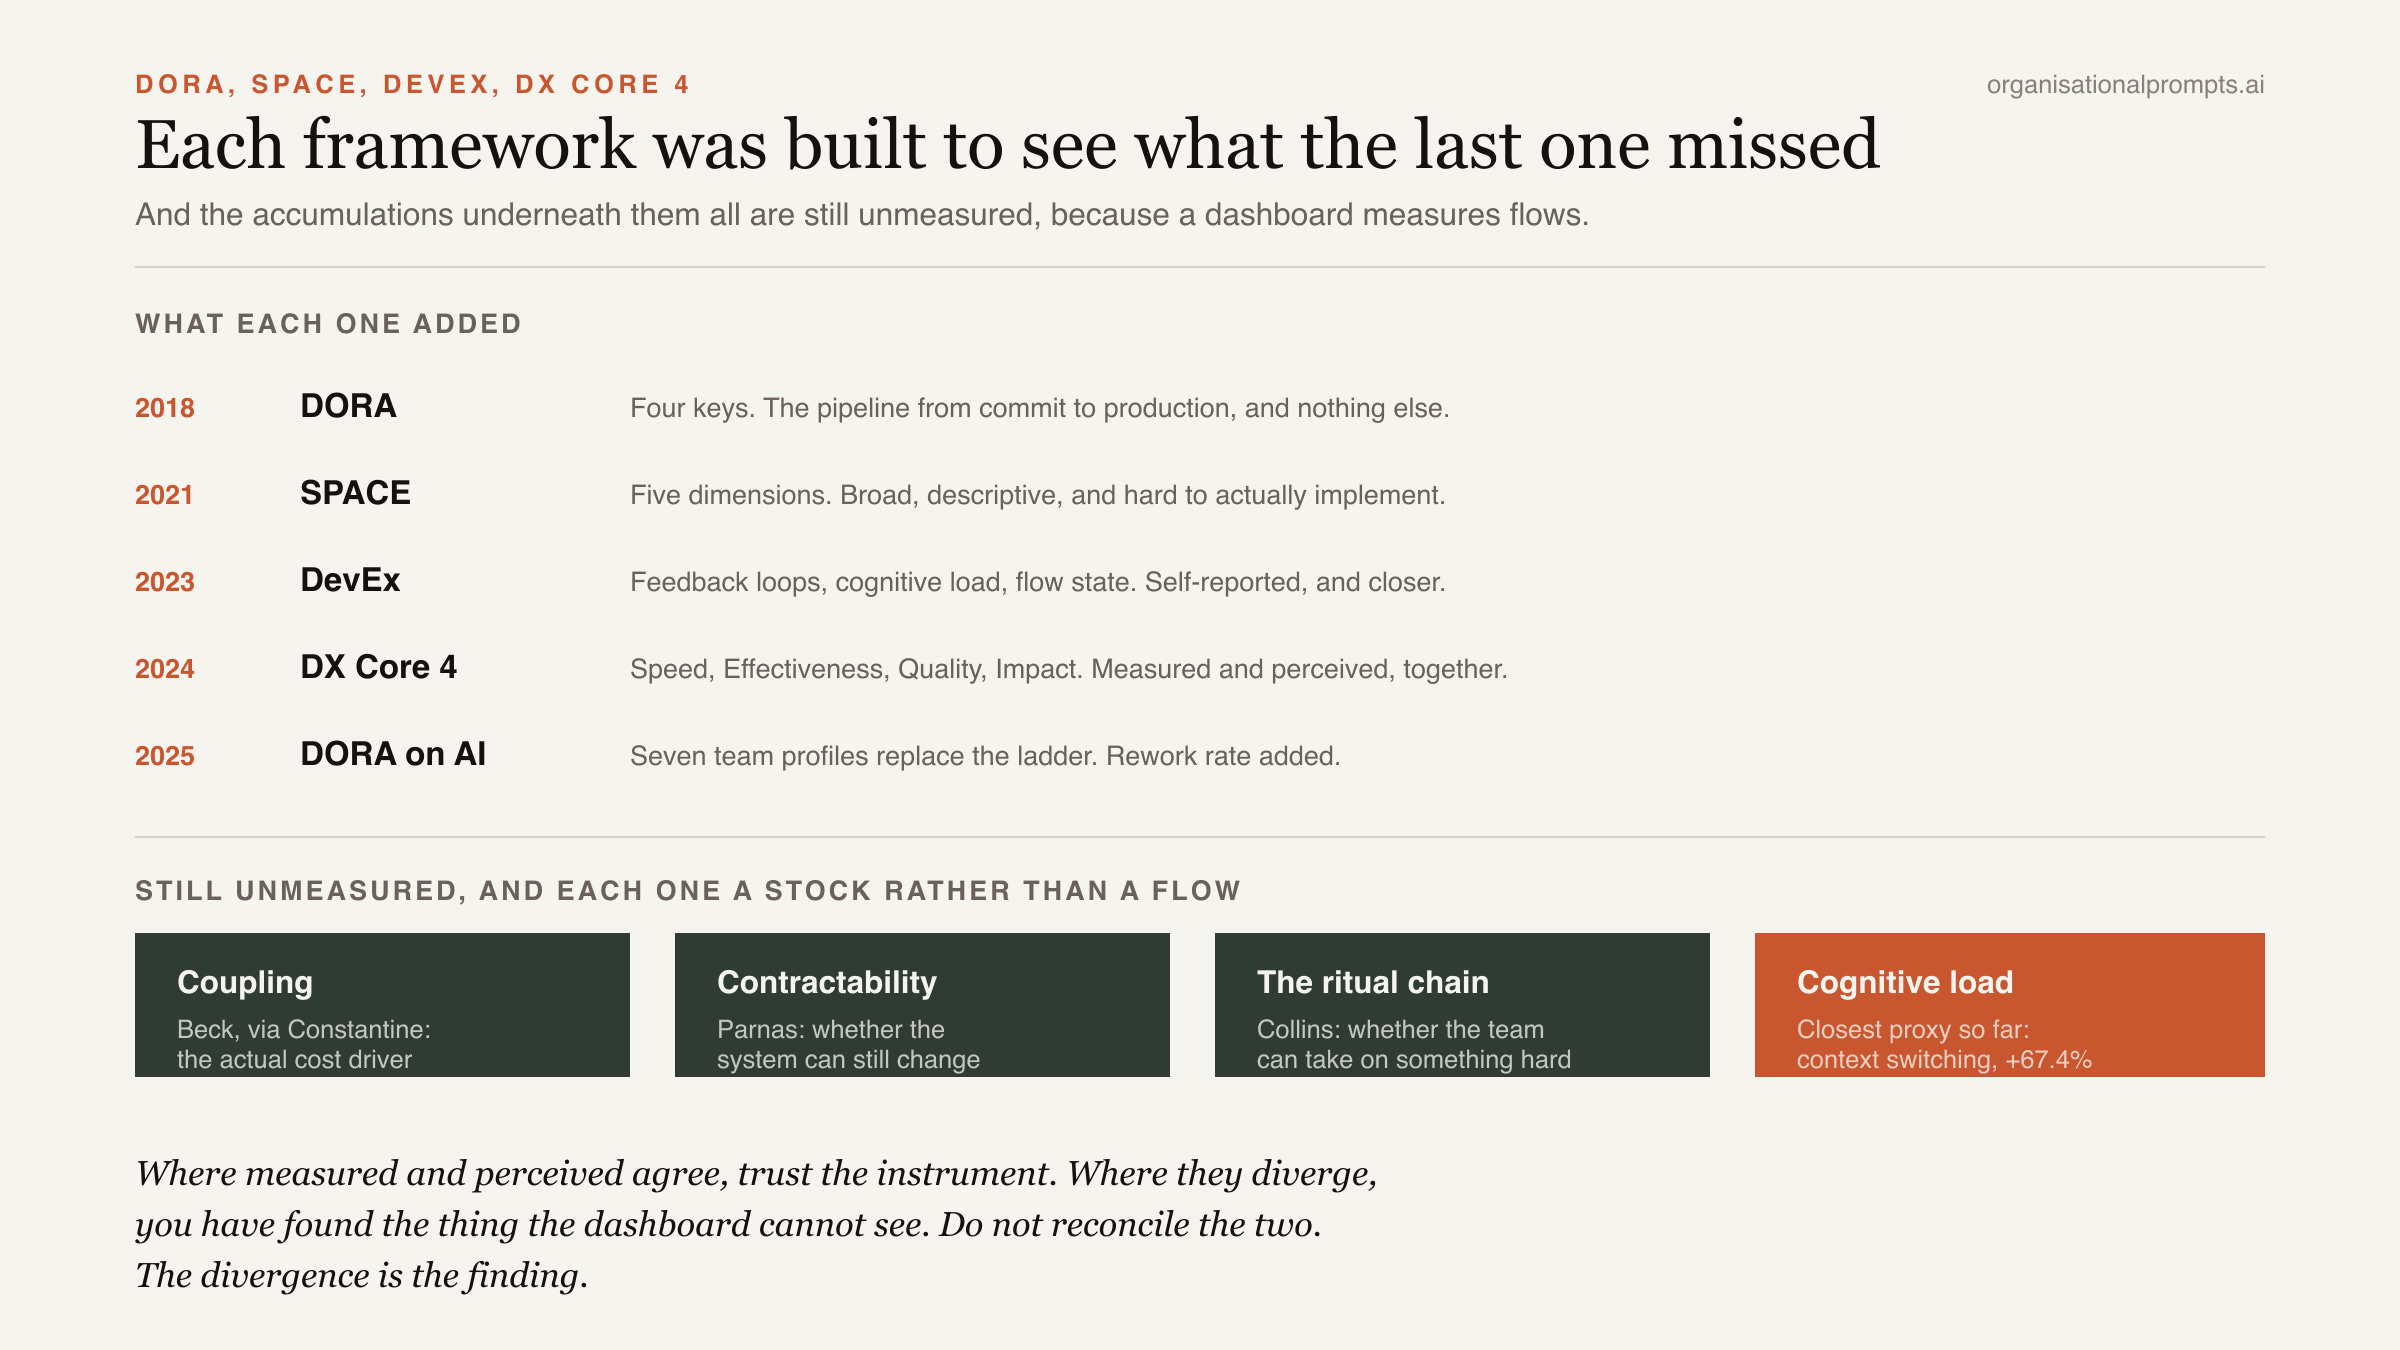
1. Four frameworks, each built to see what the last one missed
The lineage is short and worth knowing, because each step was a response to a real blind spot.
DORA came first, in the research Nicole Forsgren, Jez Humble and Gene Kim published as Accelerate in 2018. Four metrics: deployment frequency, lead time for changes, change failure rate, and time to restore service. Prescriptive, quantitative, evidence-backed, and narrow. They describe the pipeline from commit to production and almost nothing else.
SPACE followed in 2021, from Forsgren, Margaret-Anne Storey, Thomas Zimmermann and others, adding satisfaction, performance, activity, communication and efficiency. Broader, and descriptive rather than prescriptive, which meant teams had to invent their own measures and mostly gave up.
The DevEx framework arrived in 2023, from Abi Noda with Forsgren, Storey and Michaela Greiler, and narrowed onto three things developers actually experience: feedback loops, cognitive load, and flow state. Note the middle one. Ousterhout’s quantity and Skelton’s constraint finally appear in a measurement framework, and they are measured by asking people.
Then in December 2024, Noda and Laura Tacho at DX published the Core 4, built with the authors of the other three as advisors. Four dimensions, Speed, Effectiveness, Quality and Impact, each with one key metric and three secondary ones. It exists because executives kept asking what exactly to measure and getting “it depends”.
2. The most argued-about number in the set
The Core 4’s key Speed metric is diffs per engineer per week. Not lead time, not deployment frequency.
The reasoning is about translation rather than about truth. Take lead time to a finance director and you get asked why it matters; say each engineer ships four and a bit changes a week and the conversation continues. A real problem, solved.
It is also, under free generation, the single metric most exposed to inflation, and DX know it. Diffs per engineer goes up when an agent writes the diffs. It goes up when pull requests get split. It goes up when nobody is reading them. If you take one number from this framework into a board pack, take a different one.
What redeems the design is the part that looks like a weakness. The Core 4 deliberately mixes measured metrics with self-reported ones, including perceived rate of delivery and perceived software quality. Noda’s analogy is an endurance athlete’s rate of perceived exertion, and it is the right analogy. A runner whose heart rate says one thing and whose legs say another has learned something, and so has an organisation whose diffs are up thirty per cent and whose engineers report feeling slower.
The gap between measured and perceived is not an embarrassment to be reconciled. It is the finding.
3. What DORA found when it looked at AI
DORA’s 2025 report on AI-assisted development surveyed around five thousand people, and found adoption at roughly ninety per cent, which means the question has stopped being whether to adopt.
Two results matter. First, throughput reversed. In 2024 AI adoption was associated with reduced delivery throughput; in 2025 the association is positive. Teams have learned to ship faster with these tools. Second, and simultaneously, delivery instability continues to rise: more change failures, more rework, longer to recover. The systems downstream of generation have not adapted to the pace of generation, which is the argument these articles have been making since the Ohno article.
The third result is the one I keep coming back to. AI showed no measurable effect on friction or on burnout. Not an improvement, not a deterioration. DORA’s reading is that these are properties of the organisational system rather than of the individual workstation. Put less politely: your people are not exhausted because of their tools, and a better tool will not fix it.
DORA also did something braver than most research programmes manage. It threw away its own famous ranking. The Elite, High, Medium and Low performer ladder is gone, replaced by seven team profiles that combine delivery performance with friction, burnout and perceived value, running from foundational challenges through legacy bottleneck up to harmonious high-achievers. Roughly forty per cent of teams land in the top two, which is a more encouraging finding than the old ladder ever produced. A fifth metric appeared as well: rework rate.
And the headline conclusion is one sentence long. AI is an amplifier. It magnifies the strengths of high-performing organisations and the dysfunctions of struggling ones. Which makes AI adoption an organisational transformation rather than a tooling decision, and puts DORA and this series in the same position by different routes.
4. The capability that decides the sign
Buried in the AI Capabilities Model, which names seven practices that amplify AI’s benefit, is a result that should change how you sequence your investment.
Without a user-centric focus, AI adoption is associated with a negative impact on team performance. With it, the association turns positive. The same tools, the same money, opposite signs, depending on whether the organisation is oriented towards the people using its software.
That is Ohno’s pull signal arriving in survey data. An organisation that generates because generation is available produces waste at speed. An organisation that generates in response to a real demand produces value at speed. The tool does not know which one it is in.
5. What none of it measures
Almost nothing these articles say matters is measured at all, which is why I opened by saying measurement will not rescue you.
Faros telemetry from 2026, across roughly twenty-two thousand developers, gets closest. Developers using AI handle 67.4 per cent more pull request contexts a day and 17.7 per cent more task contexts, both sharply up on the prior year. Work restarts are up 13.8 per cent. Twenty-six per cent more in-progress tasks sit for a week or more with no activity at all. That is the nearest thing anyone has published to measuring cognitive load directly, and it is measuring context-switching as a proxy for it.
Everything else these articles say matters remains unmeasured. Coupling, which Beck via Constantine identifies as the actual cost driver of your software. Contractability, which Parnas makes the test of whether the system can still be changed. The accumulated ritual chain of a team, which Collins says determines whether it can take on something hard. Each of these is a stock rather than a flow, and every dashboard ever built measures flows.
So use the frameworks for what they are good at, which is detecting the gap between what you believe and what is happening. Then accept that the accumulations require somebody to go and look.
The next two articles close the Building group: the nine methods for building, and an honest account of why organisations cannot do it.
Placement: Building, the third of the series' four phases, after Learning and Deciding and before Transforming. Measurement cuts across all three levers rather than sitting on one, because a metric is at once a description (Information), a claim about who is accountable (Identity) and a signal that changes how the parts relate (Interaction). The Build Is the Test opens this stretch of the argument.
(An Organisational Prompt is something you can do now....)
Organisational Prompt
Put the measured number and the felt number on the same page.
Take one team and one quarter. On the left, the measured column: diffs per engineer, lead time, change failure rate, rework rate. On the right, a perceived column, gathered by asking every member of the team two questions and writing down what they say. Has your rate of delivery gone up or down this quarter? Has the quality of what you ship gone up or down?
Do not average the two columns and do not attempt to reconcile them, because reconciling is how organisations destroy the only useful thing on the page. Put them side by side and look at the sign of each.
Where measured and perceived agree, you can trust the instrument. Where they diverge, you have found the thing your dashboard cannot see, and the divergence tells you which direction to look. Diffs up and perceived delivery down means the gain is being absorbed downstream. Quality measures flat and perceived quality down usually means people are shipping code they could not walk you through line by line.
Then add three numbers nobody asks for. The proportion of your codebase changed in the last year that no current employee could explain. The age of your oldest open branch. The time it would take to remove one dead feature. None of them is on a dashboard. All three are knowable in a fortnight, and together they will tell you more about next year than the four keys will.
Further Reading
DORA’s publications index carries the 2025 State of AI-assisted Software Development report and the AI Capabilities Model companion, both free. Read the seven team profiles first and find yours before you read anything else in it.
Abi Noda: Introducing the DX Core 4 (December 2024), with the fuller research paper behind it. Short, prescriptive, and unusually candid for a vendor about what the earlier frameworks could not do and why.
Faros AI’s analysis of the DORA 2025 report sets the survey findings against its own telemetry across tens of thousands of developers. The context-switching numbers are the most useful data in the field right now.
I write about the industry and its approach in general. None of the opinions or examples in my articles necessarily relate to present or past employers. I draw on conversations with many practitioners and all views are my own.