
Tasks completed per developer, up 33.7 per cent. Pull requests merged per developer, up 16.2. Median time a pull request sits waiting for review, up 441. Bugs per developer, up 54. Incidents per pull request, up 242.7. Those five come out of one dataset, two years of telemetry across 22,000 developers and more than 4,000 teams, published by Faros this year under a title that does the work of a paragraph: the Acceleration Whiplash.
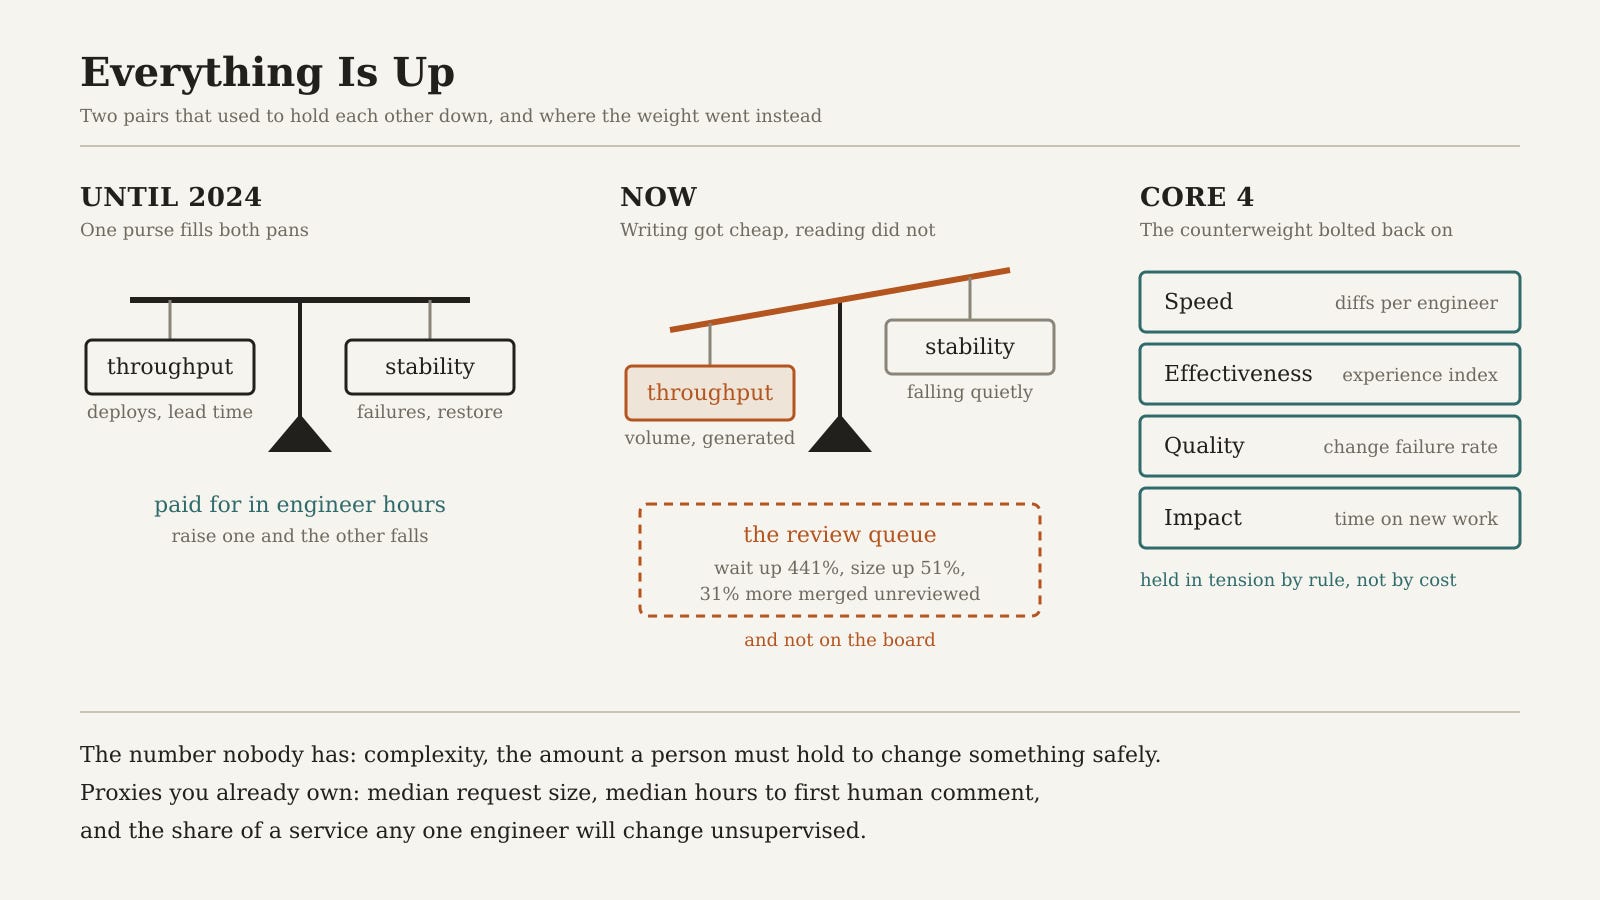
A board on which every number is rising is not reporting performance. What it reports is that the numbers have stopped pulling against one another, and the pulling was the point. The four DORA keys were arranged as two pairs in opposition, so that no team could buy speed with stability. The counterweight has come off the other pan, and most of us are still reading the number as though it means what it used to.
1. The opposition was the invention
Nicole Forsgren spent four years measuring software organisations before Accelerate appeared in 2018, and the durable result was never the four metrics. It was the shape they were arranged in. Deployment frequency and lead time for changes report how fast work moves. Change failure rate and time to restore service report what happens when it goes wrong. Two of each, deliberately, because the industry believed speed and stability traded against each other and the data said the reverse: the fastest organisations were usually the most stable ones too.
That finding held because both pockets were filled from the same purse. Every change cost an engineer the hours to write it, so throughput limited itself, and any shortcut taken to raise throughput surfaced in the failure numbers within a quarter or two. You could not run one number up without the other coming down. Speed and stability were never opposites; they were two readings of the same discipline.
2. Writing got cheap and reading did not
Generation changed the price of exactly one step in that loop.
The Faros telemetry has pull request size up 51.3 per cent and median review time up 441 per cent, against 91 per cent in the previous year’s dataset. It also has 31 per cent more pull requests merging with no review at all. Organisations rarely decide to stop reading code. They discover that they have. The cheapest way to keep the visible number moving was to keep the review step on the board and stop reading inside it, and that is the route the work took. Writing is cheap now. Reading is not, and reading is where the cost of writing went.
What is being bought is smaller than the story around it. Brian Houck’s first quarter data for 2026 puts AI at 27.4 per cent of production code on average, with adopting teams gaining roughly 7.8 per cent in pull request throughput. Real, measurable, worth having. Nobody wrote that number into the business case.
3. What your measurement system is actually for
Stafford Beer had a rule for reading any organisation without arguing about intentions: the purpose of a system is what it does. Turn it on the board. A metric set’s purpose is whatever behaviour it reliably produces. So if yours makes volume visible, leaves review expensive, and rewards volume while measuring nothing about review, then unreviewed volume is what your metric set is for.
It is working.
The defence we usually reach for at this point is maturity: strong practice, good tests, a platform, a real deployment pipeline. Faros went looking for that protection in the 2026 data and did not find it. Organisations with high baseline maturity show the same deterioration downstream as everyone else. Whatever is protecting you, it is not your maturity model.
4. Goodhart, quoted properly
The line everybody quotes belongs to Marilyn Strathern, who wrote in 1997 that a measure which becomes a target stops being a good measure. Charles Goodhart’s own formulation from 1975 is less quotable and more use. His claim was that an observed statistical regularity collapses once pressure is placed on it for control purposes.
Read the last decade of engineering measurement against that sentence. A research programme observed a regularity across thousands of organisations. The industry then adopted the regularity as a control target, printed it on quarterly slides and attached it to promotion cases. That alone is enough to break the relationship. No new technology required. Generation did not snap the four keys; it arrived at a set of measures already carrying years of control pressure, and leaned.
That reading is mine rather than DORA’s. Their own recent work is more careful than most of what gets written around it. The 2024 report put a 25 per cent rise in AI adoption alongside a 1.5 per cent fall in delivery throughput and a 7.2 per cent fall in stability. The 2025 report named the mechanism. AI is an amplifier, and what it amplifies is whatever the organisation already was.
5. Rebuilding the counterweight by hand
Abi Noda and Laura Tacho published the DX Core 4 in December 2024, with Forsgren, Margaret-Anne Storey, Michaela Greiler and Thomas Zimmermann around the work. It folds DORA, SPACE and DevEx into four dimensions: Speed, Effectiveness, Quality and Impact. Speed is headed by diffs per engineer. Effectiveness is the Developer Experience Index, a fourteen-item survey. Quality is change failure rate. Impact is the share of engineering time going into new capabilities rather than maintenance.
Diffs per engineer is the provocation and they know it. Their conditions are explicit: never at the individual level, never a target and never tied to a reward, always counterbalanced by an oppositional measure. They state the design principle in the open, which is rarer in this trade than it should be: the dimensions exist to hold each other in tension, so that speed cannot be bought with developer experience. What Core 4 rebuilds by hand is the balance that came free until 2024, and it rebuilds it as a rule rather than a happy property of the work.
Houck’s 2026 revision adds a distinction worth stealing whatever framework you run. Keep diagnostic telemetry apart from outcome metrics. Adoption rates, token spend and tool coverage tell you what is being consumed, and they tell you nothing about whether anything got better. An input sitting on the same slide as an outcome tends to be read as one. Adoption is not a result. It is a bill.
6. The number nobody has
Neither framework measures complexity.
Ousterhout named the quantity from inside the code: what a developer must hold in their head to change something safely. Skelton and Pais named the same quantity at the scale of a team and made it the constraint on how you draw boundaries. Nobody has a number for it, and it is the quantity that has moved furthest since 2024. Not DORA, and not Core 4.
Everything worsening on your board is its shadow. Review takes longer because there is more to hold. Bugs rise because less of it is being held. Incidents rise because what was held was held by nobody in particular, which is what shallow ownership feels like at two in the morning. More to hold, less of it held, and no number anywhere on the board that says so.
Three proxies are available from tooling you already own: median pull request size, median hours from opening to first human comment, and the share of a team’s services any single engineer will change unsupervised. None of them is complexity. All of them move when complexity moves, and that is enough to run a serious conversation on, which is more than your board is giving you now.
7. Where to stand
Taiichi Ohno took reports seriously and facts more seriously, and the difference between the two was a walk to where the work was happening. Numbers tell you where to go and stand. They do not tell you what is happening once you are there, and no board has ever produced the sentence you need most, which is somebody saying out loud that they approved a change they did not read.
That board was designed for an organisation in which writing was the expensive step. Reading is the expensive step now. Not one of the four keys knows it.
Placement: Building, the third of the series’ four phases, which run Learning, Deciding, Building, Transforming. Measurement sits on the Interaction question, the one about how teams, components and agents relate to each other. Conway returned here to report what team structure had already done to the architecture. Measurement is where that report either turns into numbers or does not.
(An Organisational Prompt is something you can do now....)
Organisational Prompt
Put the review queue on the same slide as deployment frequency.
Take one team and its last fifty merged pull requests. For each one, record four things: lines changed, hours between opening and the first human comment, whether any human comment exists at all, and roughly how much of the diff was generated.
Three numbers come out. Median size. Median wait. The count that merged with nobody’s comment on them.
Put those three beside your deployment frequency and change failure rate, on one slide, for the same period. If deployment frequency is up and any of the three has worsened, you have bought throughput with review, and the purchase was made for you rather than by you.
Then say which of three things you are doing about it, out loud, in a meeting that ends in a decision: pay for review properly, cut the size of what has to be reviewed, or accept unreviewed merges in a named part of the estate for a named period. Doing the third by accident is the only option not available to you. Review is either on the board or it is not, and review that is not on the board is not happening.
Further Reading
Accelerate (2018), by Nicole Forsgren, Jez Humble and Gene Kim. The 2025 State of AI-assisted Software Development report and its companion AI Capabilities Model are free at https://dora.dev/publications/.
Abi Noda, Laura Tacho, Margaret-Anne Storey and Michaela Greiler: Measuring developer productivity with the DX Core 4, free at https://getdx.com/research/measuring-developer-productivity-with-the-dx-core-4/. The benchmark data behind it is published too.
Faros: AI Engineering Report 2026: The Acceleration Whiplash, summarised at https://www.faros.ai/blog/key-takeaways-from-the-dora-report-2025. Telemetry rather than survey, which is why it disagrees so sharply with how developers report they feel about the same work.
I write about the industry and its approach in general. None of the opinions or examples in my articles necessarily relate to present or past employers. I draw on conversations with many practitioners and all views are my own.